With the DT-Performance Analyser (DT-PA), you can visualize darktable’s computing performance. Find out exactly which modules demand your hardware, whether your graphics card is being used optimally, and where time is being lost.
Step 1: Generate Log Command
Use the following configurator to create the appropriate command for your system. Select your platform and the desired test image.
Note: For better comparability with other systems, we recommend the 61MP or 24MP standard files.
Step 2: Execute Command & Create Log
- Click Copy in the tool above to copy the command to the clipboard.
- Open your terminal (Windows: CMD or PowerShell, Linux/macOS: Terminal).
- If necessary, navigate to the folder where your test image is located.
- Paste the command and confirm with Enter.
Step 3: Start Analysis
Once you have created your log file (the .txt file), you can evaluate it:
- Switch to the DT-PA Performance Analyser Tool.
- Click on the “Add Log Files” field or drag and drop your file directly into the window.
- The tool reads the data immediately and automatically creates the timeline and memory overview.
Note: The data is not transferred to our server; it is processed locally in your browser.
Using the Tool
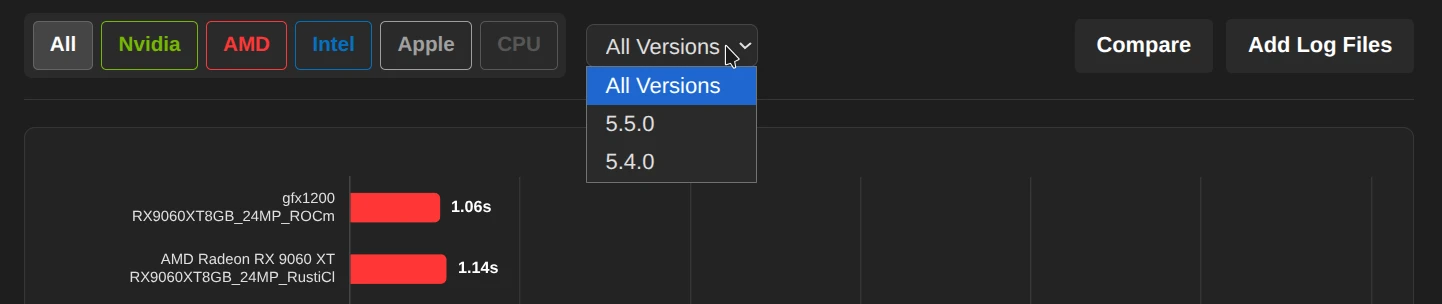
Filter & Sorting
- Manufacturer filter: Click on
Nvidia,AMD,Intel,AppleorCPUto narrow down the list to specific hardware types. - Version: Use the dropdown menu to isolate results from a specific Darktable version (e.g., 5.5.0).
- Sorting: By default, the list is sorted by total time (fastest results at the top).
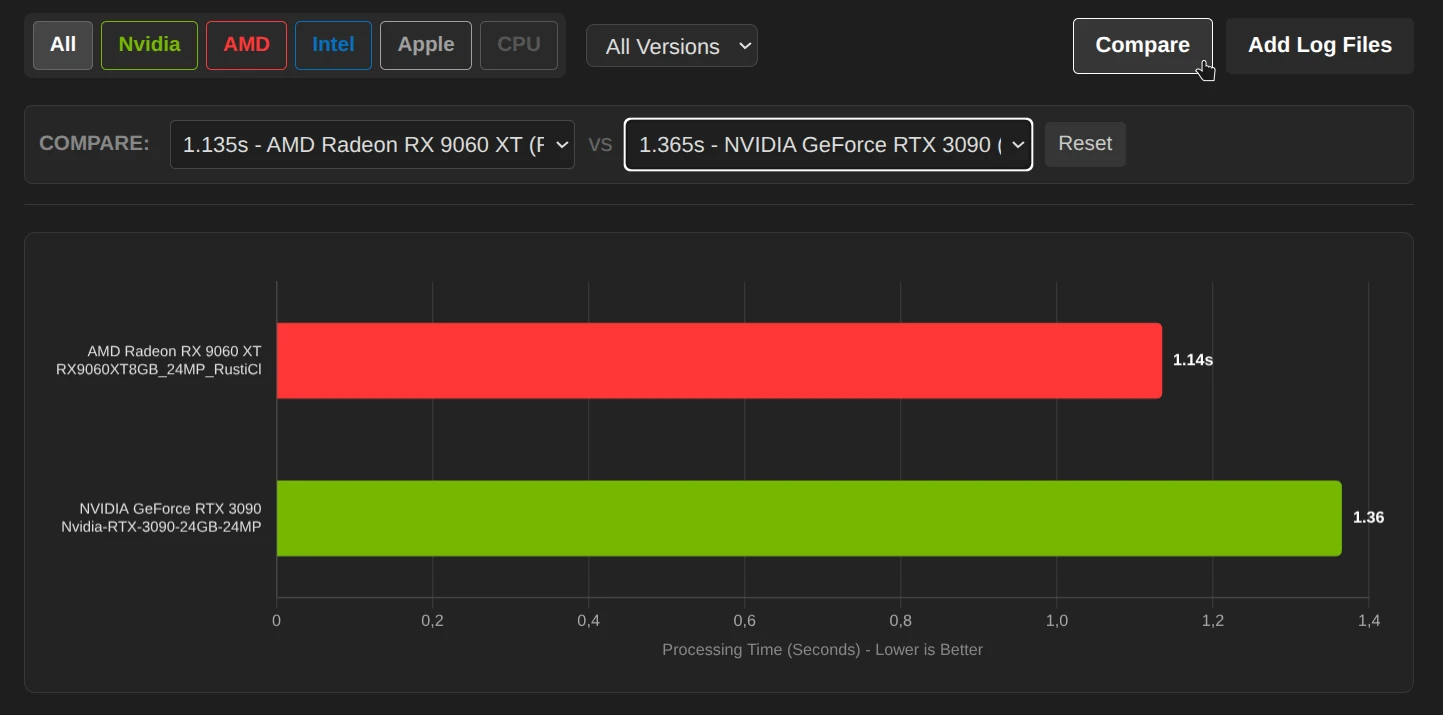
Compare mode
Would you like to compare two graphics cards or drivers directly?
- Click on the button in the top right
Comparecorner. - A bar will open where you can select Run A and Run B from the list.
- The diagram and table now only show these two entries to make differences immediately visible.
You can also compare your own hardware with “Add Log Files.”
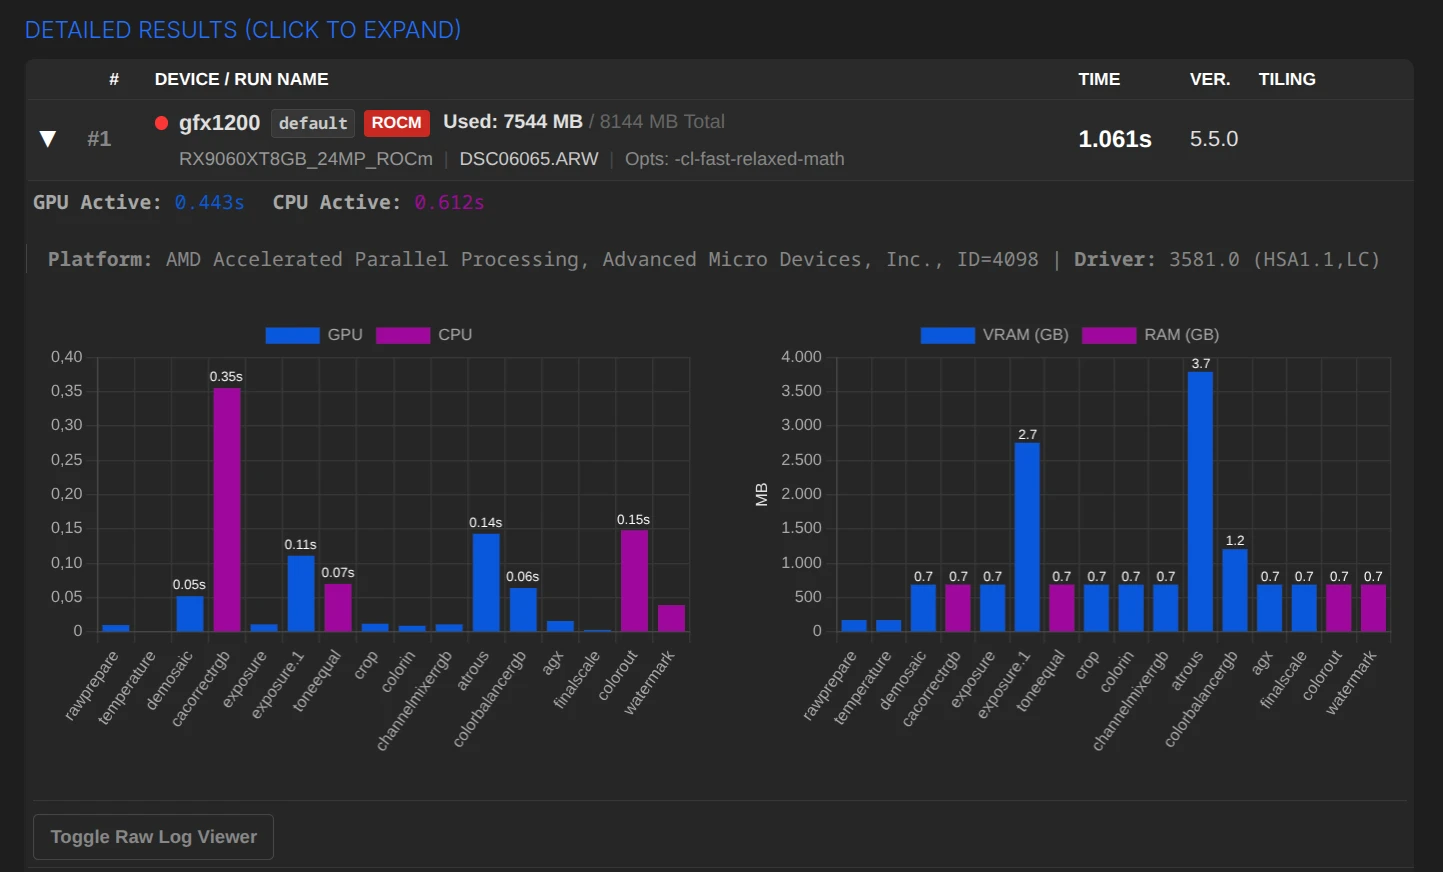
Detailed view
Click on any row in the table to expand the details:
- Timeline (left): Shows exactly which module (e.g., denoise, exposure) took how long and whether it was calculated on the GPU (blue) or CPU (purple).
- Memory (right): Shows VRAM (graphics memory) and RAM usage per module.
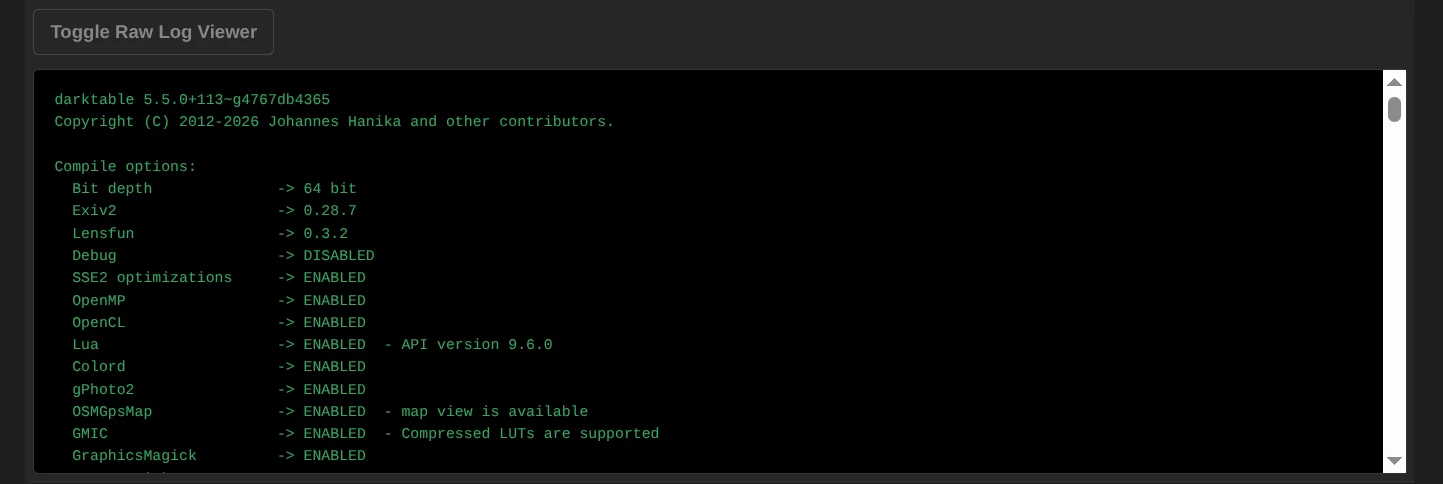
- Raw Log: For developers and experts, there is a button to view the original log file.
February 7, 2026