User Manual: DT-RM – Realtime Monitor
This tool is used for real-time analysis of darktable pixelpipe performance. It reads the log outputs from darktable and visually displays which modules consume how much time.
Browser Compatibility for the Realtime Monitor
This tool uses the modern File System Access API to read local log files in real time without having to constantly re-upload them.
- Fully Supported Browsers (Live Mode): The tool’s automatic real-time update function works exclusively in Chromium-based browsers. These include Google Chrome, Microsoft Edge, Brave*, and Opera (desktop versions).
- Limited Support (Snapshot Mode):
In Firefox and Safari, direct file access is technically not possible. The tool still works but must be updated manually: Clicking “Log File” reloads the current state of the file (snapshot); an automatic live update does not take place.
Summary Table
| Browser | Engine | Mode in Tool |
|---|---|---|
| Chrome | Blink | ✅ Live Realtime |
| Edge | Blink | ✅ Live Realtime |
| Opera | Blink | ✅ Live Realtime |
| Brave | Blink | ✅ Live Realtime |
| Vivaldi | Blink | ✅ Live Realtime |
| Firefox | Gecko | 📸 Snapshot (Click-to-Refresh) |
| Safari | WebKit | 📸 Snapshot (Click-to-Refresh) |
| iPad/iPhone | WebKit | 📸 Snapshot (Click-to-Refresh) |
In *Brave, the function must be enabled. To do this, enter the following command in your browser’s address bar: brave://flags/#file-system-access-api
Important: The script has access only to the selected log file. It does not “see” any other data on your system and cannot change anything.
The script runs locally on your PC. No log data is transferred to the internet or stored on our server. You can simply save the page via the browser to use it offline.
1. Preparation (Start darktable)
For the tool to receive data, darktable must be started with extended debug parameters. Open a terminal and use the following command:
# Linux / MacOS - File is saved in the home directory
darktable -d perf -d opencl -d dev > ~/darktable_log.txt 2>&1
# Windows - File is saved in the console path!
darktable -d perf -d opencl -d dev > darktable_log.txt 2>&1 Note: darktable_log.txt is the file you need to select in the Realtime Monitor.
Important: Keep the console open!
2. First Start & Load File
- Open the DT-RM – Realtime Monitor page in your browser (Brave/Chrome recommended).
- Click the [Select Log File] button in the top left.
- Select the log file created above (
darktable_log.txt). - The status changes to “Monitoring…” (green). The tool is now monitoring the file live for changes.
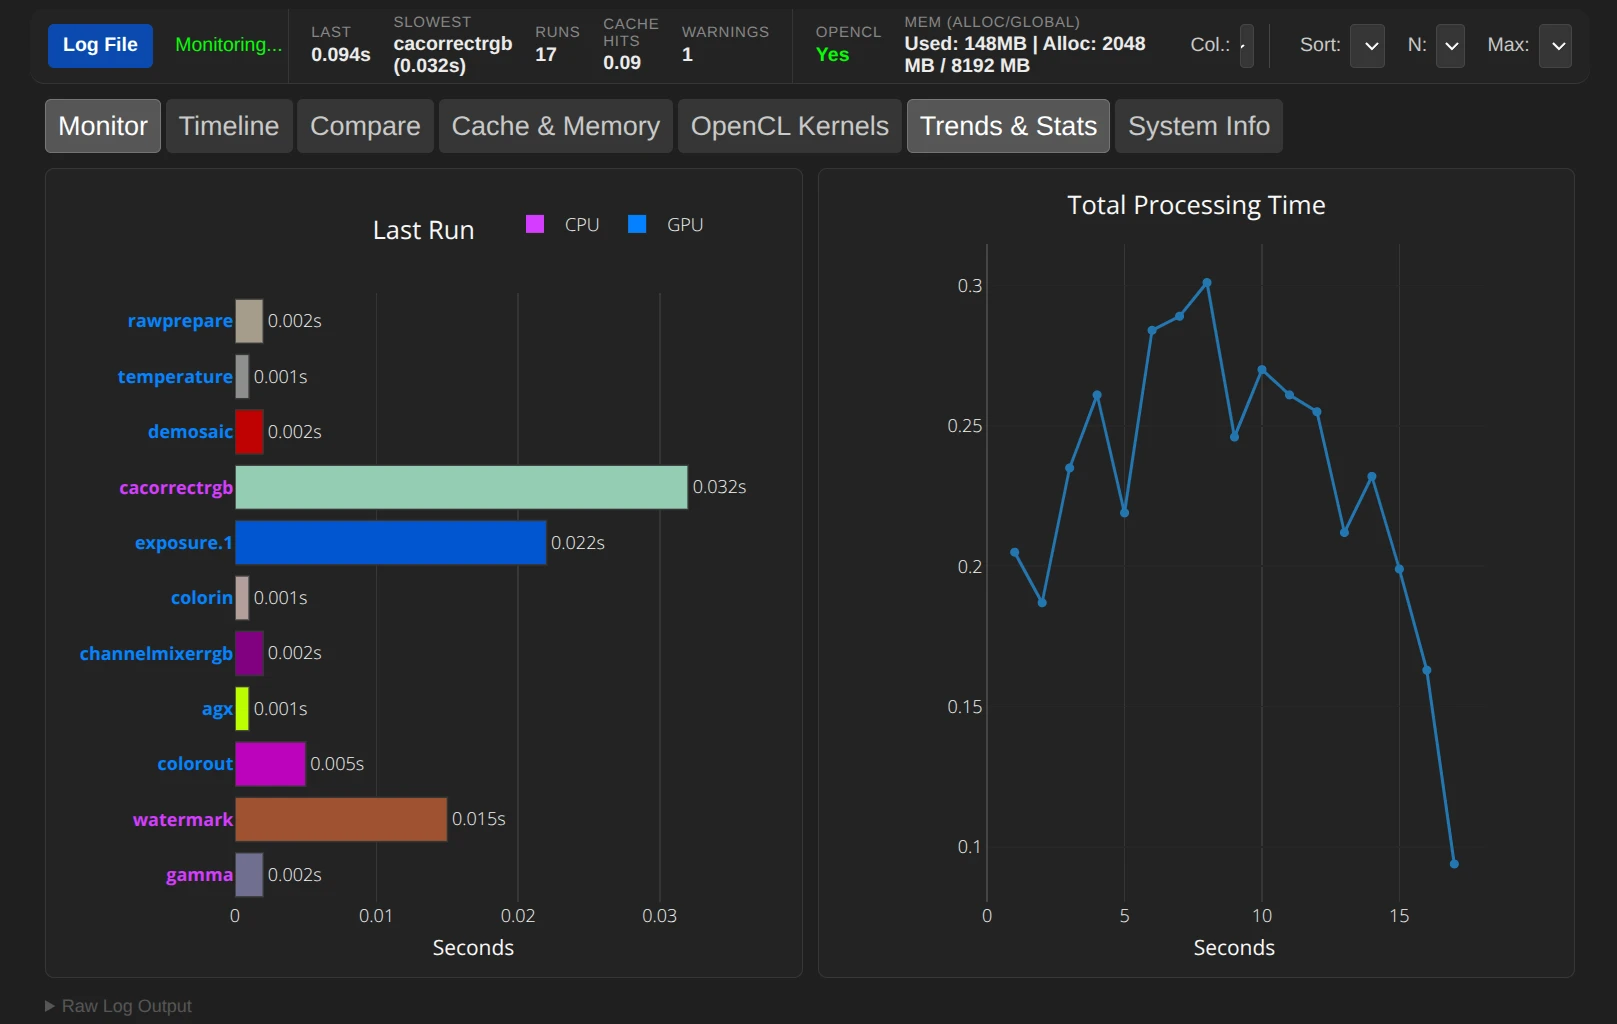
3. The User Interface at a Glance
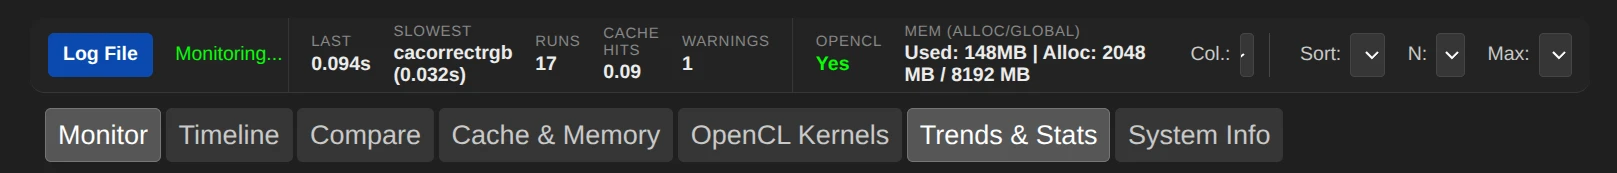
Top Bar (Metrics)
- Last: Duration of the last complete pipeline calculation.
- Slowest: The module that took the most time in the last run.
- Cache Hits: Efficiency of the darktable cache (higher is better).
- OpenCL: Indicates whether GPU acceleration is active.
- Mem (Alloc/Global): Current memory usage of your GPU.
Controls (Top Right)
- Columns (1-3): Changes the layout. You can display up to 3 tabs side-by-side simultaneously (Mega Menu style).
- Sort (Seq/Time): Sorts modules either by pixelpipe order (Seq) or by time required (Time).
- Max (Auto/0.1s – 5s): Fixes the X-axis of the graphs to better compare fluctuations.
4. The Analysis Tabs
- Monitor: The main view. Shows the last run.
- Blue marked module names = GPU processing.
- Purple marked module names = CPU processing.
- Timeline: Stacks the last runs on top of each other. Ideal for seeing how slider changes affect total time.
- Compare: Compares your live run with a reference file (e.g., an export log from the CLI).
- Cache & Memory: Visualizes memory efficiency over time.
- OpenCL Kernels: Lists specific GPU compute kernels. Important for developers or troubleshooting driver issues.
- System Info: Shows hardware details of your GPU (VRAM, Compute Units, driver version).
5. Tips for Analysis
- Finding Bottlenecks: Use the “Time” sorting in the Monitor. The top modules are your performance killers. Often, switching to a more efficient module helps here.
- Raw Log Output: At the very bottom, you can expand the “Raw Log Output” to see the original text lines from darktable if a value seems unclear.
February 7, 2026